
Research
Research interests: tensor analysis, multivariate and computational statistics, medical imaging, dimension reduction and envelope models. The three topics below describe the main lines of work. The full list of papers is on the Publications page and the code on the Software page.
Tensor Data Analysis
Many modern data sets are multi-dimensional arrays, or tensors. A brain image is a three-way array of voxels, an EEG recording is a channel-by-time matrix, and a study that follows images over time adds another mode. Treating every entry as a separate variable discards this structure and leaves far more parameters than observations. We develop regression, classification and clustering methods that model the tensor as a whole, using low-rank, sparse and separable-covariance structures to cut the number of free parameters while keeping the results interpretable at the level of individual voxels or regions.
Parsimonious tensor response regression (Li and Zhang, 2017, JASA) compares tensor images across groups after adjusting for covariates, and estimates the coefficient tensor with an envelope method that discards the immaterial variation in the response. The CATCH model (Pan, Mai and Zhang, 2019, JASA) classifies a categorical outcome from a high-dimensional tensor and additional covariates, and the doubly-enhanced EM algorithm (Mai, Zhang, Pan and Deng, 2022, JASA) clusters tensor observations under a tensor normal mixture model. Related work includes tensor discriminant analysis, tensor Gaussian graphical models, tensor time series, and Fréchet regression for diffusion tensor imaging. The R packages TRES and catch implement several of these methods.
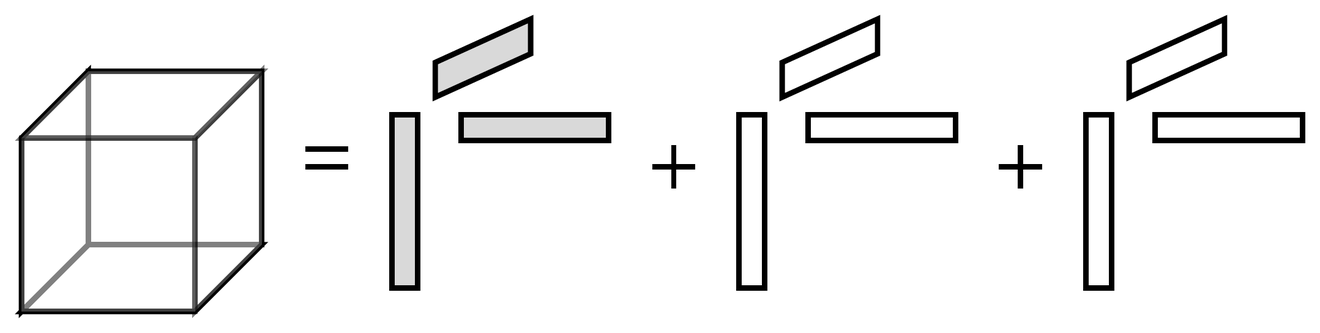
Tensors also arise as parameters. When the response consists of several categorical variables, their joint distribution given the predictors is a conditional probability tensor P(x), with one entry for each combination of categories. The number of entries grows exponentially with the number of responses: 14 binary responses already give 214 = 16,384 combinations. Estimating P(x) is one of our recent research directions. Molstad and Zhang (2026, JASA) model P(x) as a sum of a few rank-one probability tensors (figure below), motivated by the connection between the conditional independence of the responses and the rank of their probability tensor. The resulting model can be interpreted as a mixture of regressions and is fit by maximum likelihood with a penalized EM algorithm. Multi-response linear discriminant analysis (Deng, Zhang and Molstad, 2024, JMLR) and kernelized discriminant analysis (Jin, Zhang and Molstad, 2026, JCGS) approach the same joint modeling problem through inverse regression, modeling the predictors as multivariate normal given each combination of response categories. The first uses a regularized tensor formulation for high-dimensional predictors. The second uses discrete kernel regression, which scales to many responses and handles combinations of categories that never appear in the training data.
Envelope Models and Methods
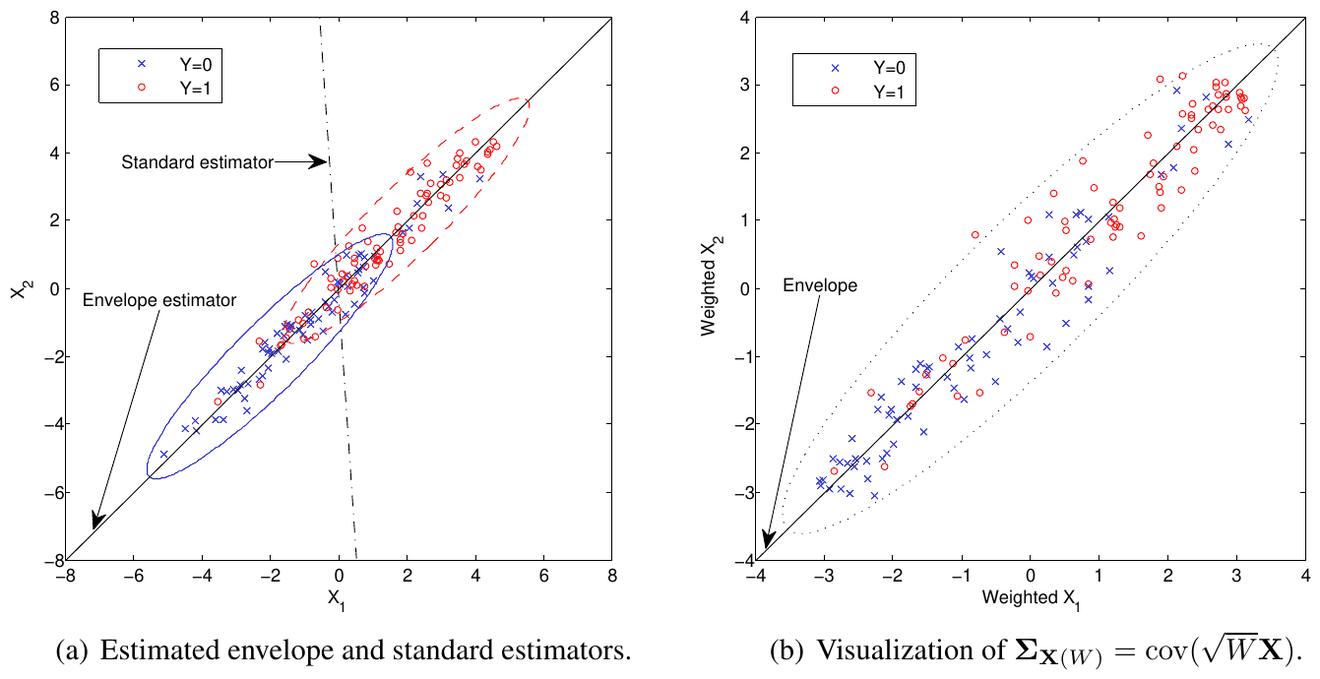
Envelopes were introduced by Cook, Li and Chiaromonte (2010) to reduce estimative and predictive variation in the multivariate linear model. The idea is that some linear combinations of the response, or of the predictors, carry no information about the parameters of interest but still add variability to their estimates. An envelope identifies this immaterial part of the data and bases estimation on the material part alone. When the immaterial variation is large the gains are substantial: in the logistic regression example of Cook and Zhang (2015), the envelope estimator had 40% and 60% smaller standard errors than the standard estimator for the two coefficients, with no change to the underlying model.
Our work extends envelopes beyond the linear model and makes them practical. Foundations for envelope models and methods (Cook and Zhang, 2015, JASA) gives a general definition of an envelope and a framework for adapting envelope methods to any estimation procedure, with applications to weighted least squares, generalized linear models and Cox regression. Other work combines envelopes with reduced-rank regression (Cook, Forzani and Zhang, 2015, Biometrika), allows nonlinear mean functions and heteroscedastic errors through model-free envelopes (Zhang, Lee and Shao, 2020, Biometrika), and develops fast estimation algorithms, model-free dimension selection, envelope mixture models for clustering, and envelopes for principal component regression. The Matlab packages on the Software page and the R package TRES implement these methods.
Dimension Reduction
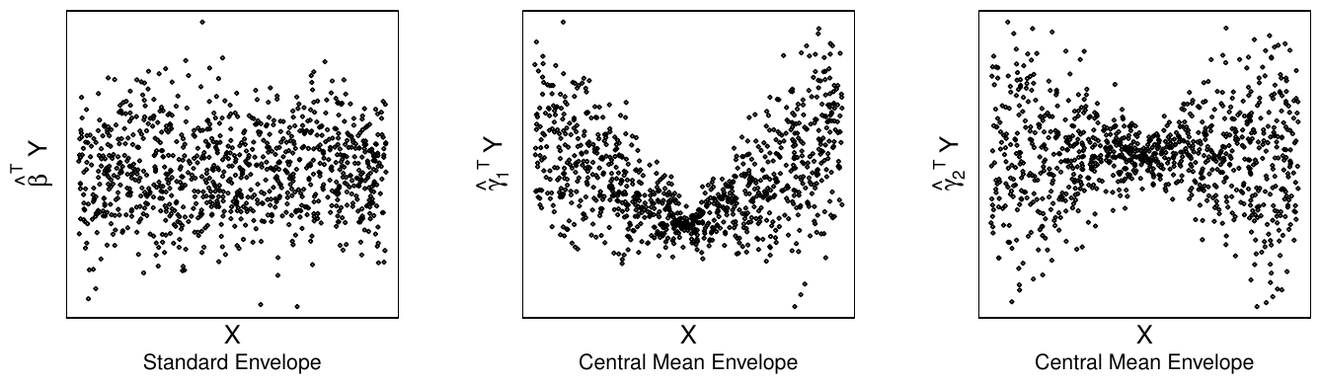
Sufficient dimension reduction replaces a high-dimensional predictor with a few linear combinations that retain all the information about the response, without assuming a parametric model for the regression. The smallest such set of directions spans the central subspace, and estimating it is the central problem of the field. Inverse regression methods estimate it from moments of the predictor within slices of the response: sliced inverse regression (SIR) uses the conditional means, and sliced average variance estimation (SAVE) uses the conditional variances.
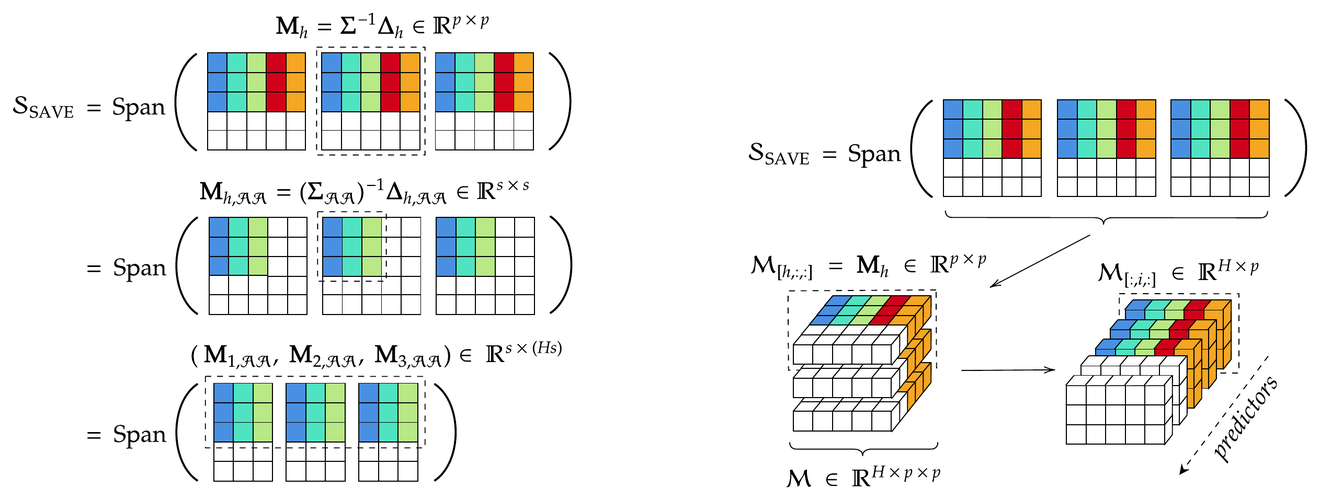
Much of our recent work extends these methods to high dimensions. SEAS (Zeng, Mai and Zhang, 2024, JASA) estimates the central subspace through a convex program that selects the structural dimension and the relevant variables at the same time. For second-order methods such as SAVE and directional regression, Zeng, Zhang and Hao (2026+, JASA) show that under sparsity the subspace depends only on the entries for the active predictors (figure below). With p predictors, s of them active, and H slices, this reduces the number of parameters from p2H to s2H. Their two-step estimator first selects variables by a group-lasso-type convex program and then estimates the subspace by nuclear-norm penalized optimization, and it is consistent in dimension selection, variable selection and subspace estimation. Projecting the data onto the estimated subspace before quadratic discriminant analysis gives a sparse classifier with theoretical guarantees.
For categorical responses, the maximum separation subspace (Zhang, Mai and Zou, 2020, JMLR) preserves the sufficiency of the reduction without conditions on the distribution of the predictors, and ENDS (Zhang and Mai, 2019, Technometrics) integrates dimension reduction with prediction in discriminant analysis. For associations between sets of variables, we developed a post-selection significance test for canonical correlation analysis in high dimensions (McKeague and Zhang, 2022, Biometrika) and generalized liquid association analysis (Li, Zeng and Zhang, 2023, JASA), which describes how the association between two data modalities changes with a third variable. Current directions include dimension reduction for heterogeneous populations, for Fréchet regression with responses in a metric space, and for tensor time series.
Acknowledgement
Research is or has been supported by the National Science Foundation and the National Institutes of Health.